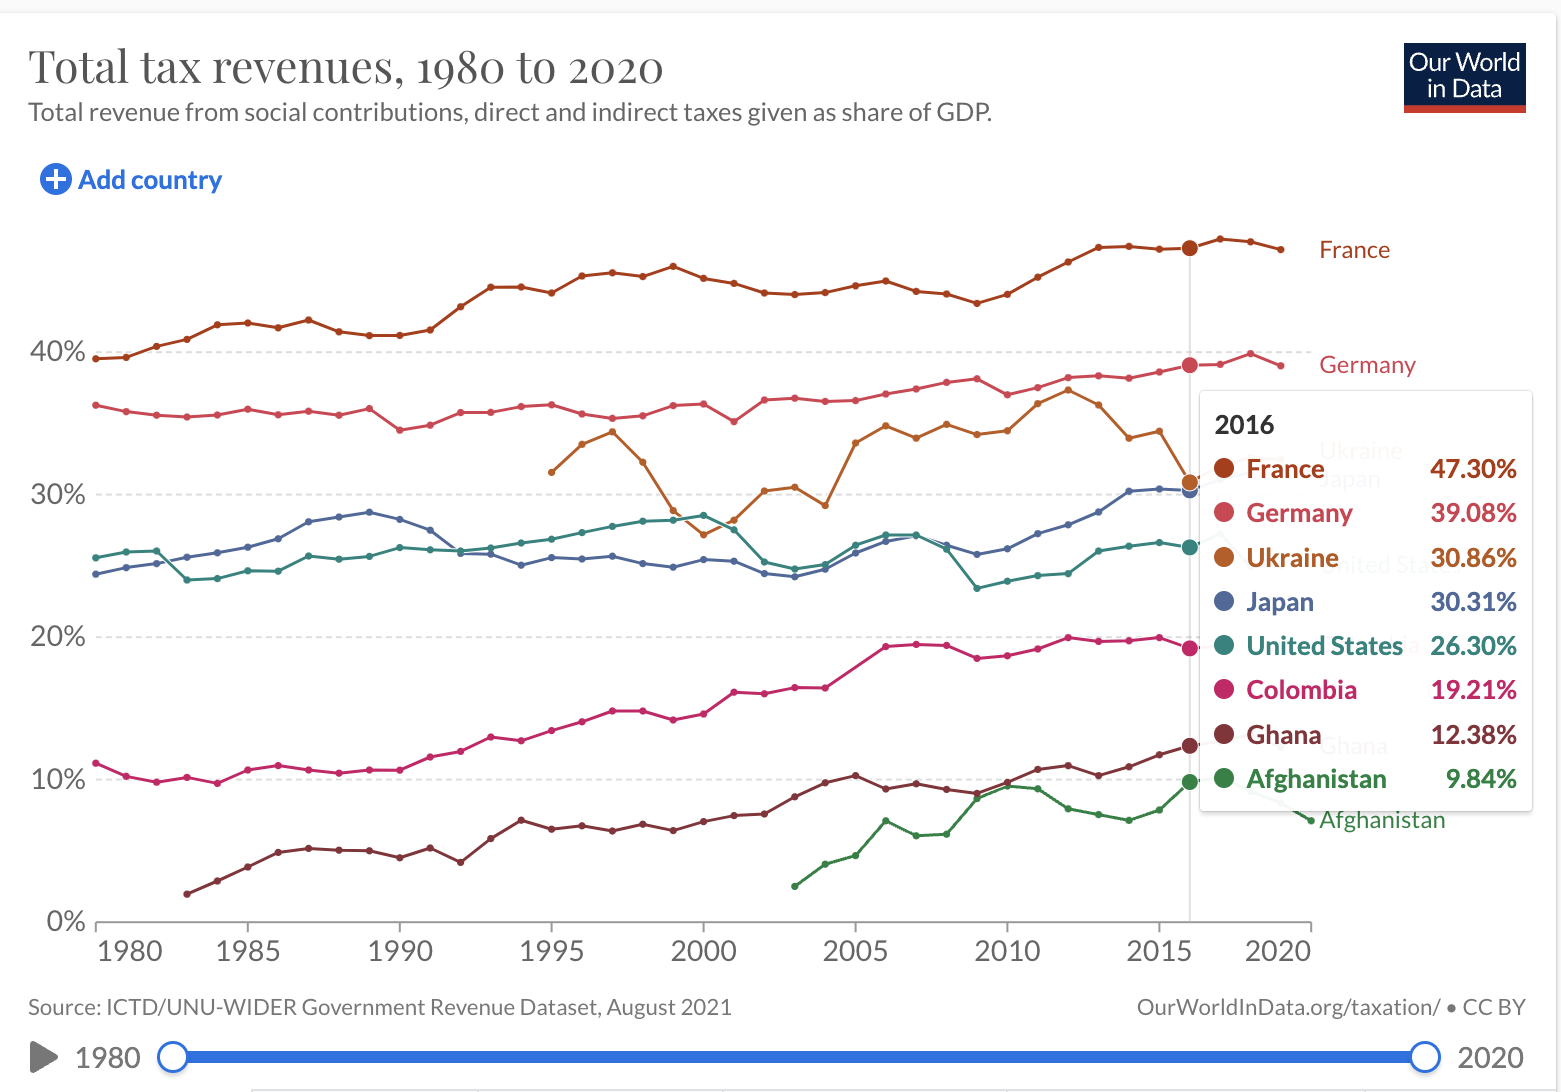
1. I choose and downloaded the tax revenue data from Our.World.in.data.I choose the Tax revenue data because I was curious about how much tax revenue do countries collect today starting from the year 1980 up to 2019.
2. This is the link to the tax revenue data.
3. I will use the coad chunck below in order to read ans pread the tax revenue data for analysis.
4. Reading the data
5. Using glimpse to see names and types of columns
glimpse(tax)
Rows: 5,757
Columns: 4
$ Entity                                       <chr> "Afghanistan", …
$ Code                                         <chr> "AFG", "AFG", "…
$ Year                                         <dbl> 2003, 2004, 200…
$ `Total tax revenue (% of GDP) (ICTD (2021))` <dbl> 2.512631, 4.076…
6. Use output from glimpse ( and View) to prepare data for analysis
create object
regionthat will list the regions I will extract data set from.Changing the names of 1st column to
regionand forth column tototl_tax_revUsing the filter feature to help extract the rows I want to keep and preview
Select columns to keep: Region, Year, Tax
Assign output to regional_tax
Display first 10 rows of regional_tax
regions <- c(
  "France",

  "Germany",

  "United Kindom",

    "Ukraine",

    "Japan",

   "United States",

    "Tukey",

     "Colombia",

     "Ghana",

     "Afghanistan" )

regional_tax <- tax %>%
  rename(Region = Entity) %>%
  rename(TotalTaxRev = 4) %>%
  filter(Year >= 1980, Region %in% regions) %>%
  select(Region, Year, TotalTaxRev)


regional_tax
# A tibble: 276 × 3
   Region       Year TotalTaxRev
   <chr>       <dbl>       <dbl>
 1 Afghanistan  2003        2.51
 2 Afghanistan  2004        4.08
 3 Afghanistan  2005        4.67
 4 Afghanistan  2006        7.12
 5 Afghanistan  2007        6.06
 6 Afghanistan  2008        6.17
 7 Afghanistan  2009        8.67
 8 Afghanistan  2010        9.56
 9 Afghanistan  2011        9.36
10 Afghanistan  2012        7.95
# … with 266 more rows
Check that total for 2015 equals total in graph
# A tibble: 1 × 1
  total_tax
      <dbl>
1      215.
Add Picture
Write data to file in the project directory
write_csv(regional_tax, file = "regional_tax.csv")